
Mathematics, 05.10.2019 09:30 atefah88
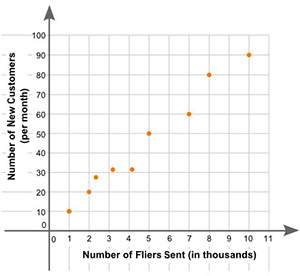
)the scatter plot shows the number of fliers mailed out in a month (in thousands) and the number of new customers small businesses had in that same month:
what will most likely be the effect on the number of new customers that a small business has if the number of fliers the business sends increases? the number of new customers will decrease because the graph shows a negative association. the number of new customers will increase because the graph shows a positive association. the number of new customers will increase because the graph shows a negative association. the number of new customers will decrease because the graph shows a positive association.

Answers: 1


Other questions on the subject: Mathematics
Mathematics, 21.06.2019 18:00, cici170
Each month, a shopkeeper spends 5x + 14 dollars on rent and electricity. if he spends 3x−5 dollars on rent, how much does he spend on electricity? for which value(s) of x is the amount the shopkeeper spends on electricity less than $100? explain how you found the value(s).
Answers: 2
Mathematics, 21.06.2019 18:20, holmesleauja
Type the correct answer in each box. use numerals instead of words. if necessary, use / for the fraction bar. consider the given table.
Answers: 1
Mathematics, 21.06.2019 22:00, afolmar2006
What is the solution to the system of equation graphed belowa.(0,-4)b.(2,5),1),-3)
Answers: 3
You know the right answer?
)the scatter plot shows the number of fliers mailed out in a month (in thousands) and the number of...
Questions in other subjects:

Biology, 03.02.2020 08:02
Biology, 03.02.2020 08:02


Health, 03.02.2020 08:02
Mathematics, 03.02.2020 08:02
Mathematics, 03.02.2020 08:02


