
Mathematics, 24.09.2019 02:30 discolldiane3708
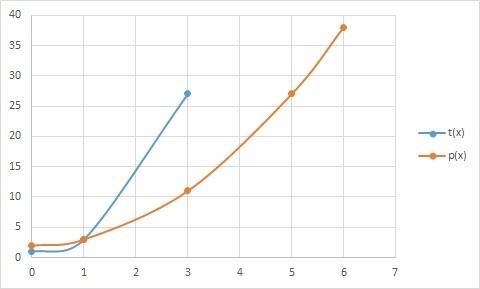
Aquadratic function and an exponential function are graphed below. which graph most likely represents the exponential function? graph of function t of x is a curve which joins the ordered pair 0, 1 and 1, 3 and 3, 27. graph of function p of x is a curve which joins the ordered pair 0, 2 and 1, 3 and 3, 11 and 5, 27 and 6, 38

Answers: 1


Other questions on the subject: Mathematics
Mathematics, 22.06.2019 01:30, fortwill05
What is the value of x enter your answer in the box (3x+50
Answers: 2
Mathematics, 22.06.2019 02:30, violet9139
Build is 120 wide 20 feet high 48 feet long how many cubic feet and the volume
Answers: 1
You know the right answer?
Aquadratic function and an exponential function are graphed below. which graph most likely represent...
Questions in other subjects:
Mathematics, 10.05.2021 06:20

Mathematics, 10.05.2021 06:20
Mathematics, 10.05.2021 06:20
Mathematics, 10.05.2021 06:20
English, 10.05.2021 06:20
Mathematics, 10.05.2021 06:20

Chemistry, 10.05.2021 06:20


