Need asap
which linear inequality is represented by the graph?
y ≤ 1/3x − 1...

Mathematics, 23.11.2019 20:31 lil8174
Need asap
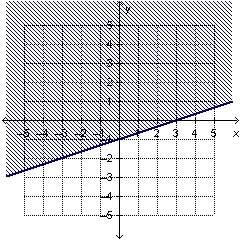
which linear inequality is represented by the graph?
y ≤ 1/3x − 1
y ≥ 1/3x − 1
y < 3x − 1
y > 3x − 1

Answers: 3


Other questions on the subject: Mathematics
Mathematics, 21.06.2019 14:50, brad7330
An assembly consists of two mechanical components. suppose that the probabilities that the first and second components meet specifications are 0.87 and 0.84. assume that the components are independent. determine the probability mass function of the number of components in the assembly that meet specifications. x
Answers: 1
Mathematics, 21.06.2019 18:00, burnsmykala23
Solve this system of equations. 12x − 18y = 27 4x − 6y = 10
Answers: 1
Mathematics, 21.06.2019 19:30, jossfajardo50
Aproduction manager test 10 toothbrushes and finds that their mean lifetime is 450 hours. she then design sales package of this type of toothbrush. it states that the customers can expect the toothbrush to last approximately 460 hours. this is an example of what phase of inferential statistics
Answers: 1
You know the right answer?
Questions in other subjects:


Mathematics, 13.02.2020 22:25


