time (x)

Mathematics, 01.09.2019 13:20 GaudySky
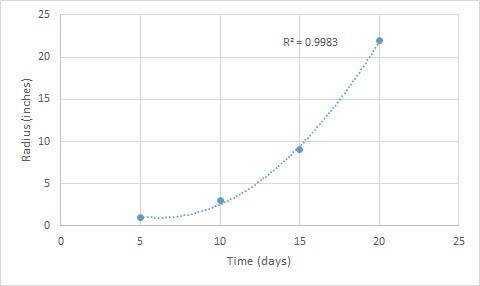
The table below shows the radius y, in inches, created by growing algae in x days:
time (x)
(days) 5 10 15 20
radius (y)
(inches) 1 3 9 22
part a: what is the most likely value of the correlation coefficient of the data in the table? based on the correlation coefficient, describe the relationship between time and radius of the algae. [choose the value of the correlation coefficient from 1, 0.94, 0.5, 0.02.] (4 points)
part b: what is the value of the slope of the graph of radius versus time between 5 and 10 days, and what does the slope represent? (3 points)
part c: does the data in the table represent correlation or causation? explain your answer. (3 points)

Answers: 1


Other questions on the subject: Mathematics
Mathematics, 21.06.2019 12:50, Kaylinne1181
The table shows a pattern of exponents. what is the pattern as the exponents decrease?
Answers: 3
Mathematics, 21.06.2019 15:30, karleebowling316
Consider the system: y = 3x + 5 y = ax + b what values for a and b make the system inconsistent? what values for a and b make the system consistent and dependent? explain
Answers: 1
Mathematics, 21.06.2019 18:30, luvme68297
Which statement justifies why angle ebc measures 90?
Answers: 3
Mathematics, 21.06.2019 20:30, marahkotelman
Arectangle has a width of 5 cm and a length of 10 cm. if the width is increased by 3, how does the perimeter change?
Answers: 1
You know the right answer?
The table below shows the radius y, in inches, created by growing algae in x days:
time (x)
time (x)
Questions in other subjects:


Biology, 29.06.2019 17:30


English, 29.06.2019 17:30
Mathematics, 29.06.2019 17:30


Social Studies, 29.06.2019 17:30


