
Mathematics, 30.09.2019 01:00 zurfluhe
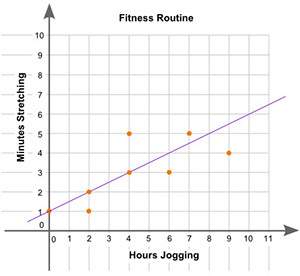
(6.04)the scatter plot shows the relationship between the number of hours spent jogging and the number of minutes spent stretching, by the students on a track team:
what is the y-intercept of the line of best fit and what does it represent?
1 minute; the number of minutes students stretch when they do not jog
1 hour; the number of hours students jog when they do not stretch
4 hours; the number of hours students jog when they do not stretch
4 minutes; the number of minutes students stretch when they do not jog

Answers: 2


Other questions on the subject: Mathematics
Mathematics, 21.06.2019 22:30, abigail251
The given diagram shows the parts of a right triangle with an altitude to the hypotenuse. using the two given measures, find the other four.
Answers: 1
Mathematics, 21.06.2019 23:00, floresguppy
Jane’s favorite fruit punch consists of pear, pineapple, and plum juices in the ratio 5: 2: 3. how many cups of pear juice should she use to make 20 cups of punch?
Answers: 1
Mathematics, 21.06.2019 23:30, Lkirjnnfcxd5039
The legs of a right triangle measure 6 meters and 8 meters. what is the length of the hypotonuse.
Answers: 1
You know the right answer?
(6.04)the scatter plot shows the relationship between the number of hours spent jogging and the numb...
Questions in other subjects:

Biology, 18.03.2021 02:10

Mathematics, 18.03.2021 02:10
Mathematics, 18.03.2021 02:10
Mathematics, 18.03.2021 02:10


