1. can you explain how a table can be used to find the rate of change?
2. how do you find the...

Mathematics, 29.10.2019 00:31 Ruchen
1. can you explain how a table can be used to find the rate of change?
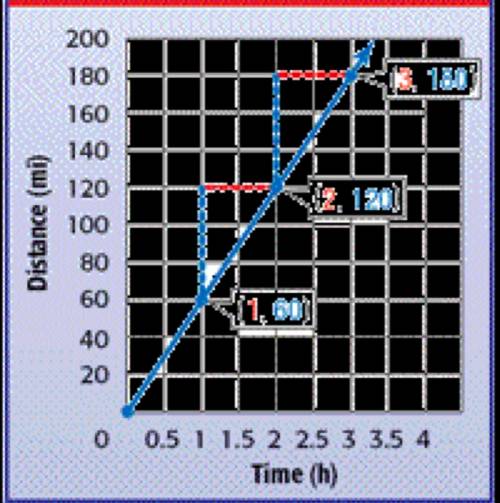
2. how do you find the rate of change using a graph?

Answers: 3


Other questions on the subject: Mathematics
Mathematics, 21.06.2019 18:00, imanim3851
Give all possible names for the line shown. calculation tip: lines can be written with either point first.
Answers: 1
Mathematics, 22.06.2019 01:30, studybug6170
Simplify the expression below -3(10x+4y)+6(6x-2y)
Answers: 2
Mathematics, 22.06.2019 03:00, willow2444
Taylor graphs the system below on her graphing calculator and decides that f(x)=g(x) at x=0, x=1, and x=3. provide taylor some feedback that explains which part of her answer is incorrect and why it is incorrect. f(x)=2x+1 g(x)=2x^2+1
Answers: 2
You know the right answer?
Questions in other subjects:


