
Mathematics, 04.02.2020 06:57 dani19cano
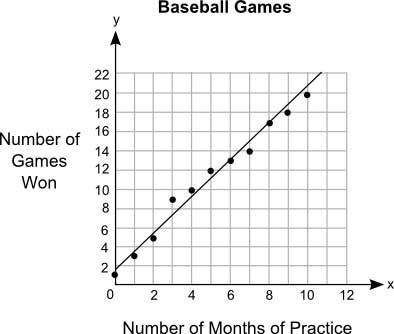
The graph shows the relationship between the number of months different students practiced baseball and the number of games they won:
the title of the graph is baseball games. on x axis, the label is number of months of practice. on y axis, the label is number of games won. the scale on the y axis is from 0 to 22 at increments of 2, and the scale on the x axis is from 0 to 12 at increments of 2. the points plotted on the graph are the ordered pairs 0, 1 and 1, 3 and 2, 5 and 3, 9 and 4, 10 and 5, 12 and 6, 13 and 7, 14 and 8,17 and 9, 18 and 10,20. a straight line is drawn joining the ordered pairs 0, 1.8 and 2, 5.6 and 4, 9.2 and 6, 13 and 8, 16.5 and 10, 20.5.
part a: what is the approximate y-intercept of the line of best fit and what does it represent? (5 points)
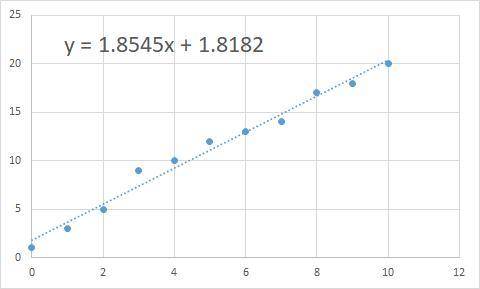
part b: write the equation for the line of best fit in slope-intercept form and use it to predict the number of games that could be won after 13 months of practice. show your work and include the points used to calculate the slope. (5 points)

Answers: 2


Other questions on the subject: Mathematics
Mathematics, 21.06.2019 19:00, megkate
1. writing an equation for an exponential function by 2. a piece of paper that is 0.6 millimeter thick is folded. write an equation for the thickness t of the paper in millimeters as a function of the number n of folds. the equation is t(n)= 3. enter an equation for the function that includes the points. (-2, 2/5) and (-1,2)
Answers: 1
Mathematics, 21.06.2019 22:30, foreignlove1039
If a flying disk is 139 meters in the air and travels at an average of 13 m/s how long is it in the air
Answers: 2
You know the right answer?
The graph shows the relationship between the number of months different students practiced baseball...
Questions in other subjects:


Mathematics, 27.11.2020 22:50
Mathematics, 27.11.2020 22:50
Mathematics, 27.11.2020 22:50


