
Mathematics, 24.09.2019 06:00 skylergibbons01
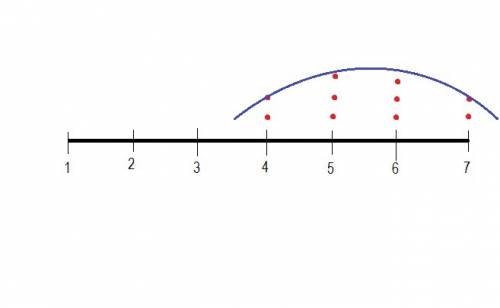
The dot plot below shows the hourly rate of some babysitters in a city: a number line is shown from 1 dollar to 7 dollars in increments of 1 dollar for each tick mark. the horizontal axis label is dollar per hour. there are 2 dots above 4 dollars, 3 dots above 5 dollars, 3 dots above 6 dollars, and 2 dots above 7 dollars. the title of the line plot is babysitting rates. which statement best describes the shape of the data? it is symmetric and has no gaps. it is not symmetric and has a peak at $7.00. it is a cluster from $1.00 to $7.00 and has no gaps. it is a cluster from $1.00 to $7.00 and has a peak at $6.00.

Answers: 1


Other questions on the subject: Mathematics
Mathematics, 21.06.2019 13:40, kps26pd2mea
The cash price of a television is $580.the hire-purchase price of the television is $865.the hire-purchase price is an initial deposit of n% of the cash price and 6 equal monthly payments of $120.find the value of n.
Answers: 1
Mathematics, 21.06.2019 16:30, jordivivar74
For how answer my question this will be the last question can you answer in math subject
Answers: 2
Mathematics, 21.06.2019 20:00, xwalker6772
Aquadratic equation in standard from is written ax^2= bx+c, where a, b and c are real numbers and a is not zero?
Answers: 1
You know the right answer?
The dot plot below shows the hourly rate of some babysitters in a city: a number line is shown from...
Questions in other subjects:


Mathematics, 15.09.2021 04:30

Biology, 15.09.2021 04:30


