
Mathematics, 05.10.2019 14:30 aprilstalder
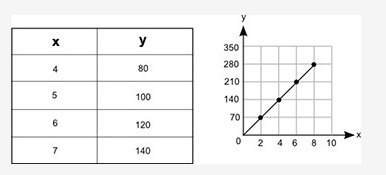
The table and the graph below each show a different relationship between the same two variables, x and y:
how much more would the value of y be on the graph than its value in the table when x = 12?
just me understand, do not give me the answer! you

Answers: 1


Other questions on the subject: Mathematics
Mathematics, 21.06.2019 14:10, valeriam24
which best describes the transformation from the graph of f(x) = x2 to the graph of f(x) = (x – 3)2 – 1? left 3 units, down 1 unitleft 3 units, up 1 unitright 3 units, down 1 unit right 3 units, up 1 unit
Answers: 1
Mathematics, 22.06.2019 00:00, nyctvinny8290
Two poles, ab and ed, are fixed to the ground with the of ropes ac and ec, as shown: what is the approximate distance, in feet, between the two poles? 6.93 feet 8.66 feet 12.32 feet 15.59 feet
Answers: 1
You know the right answer?
The table and the graph below each show a different relationship between the same two variables, x a...
Questions in other subjects:

Mathematics, 13.11.2019 22:31

History, 13.11.2019 22:31


Chemistry, 13.11.2019 22:31


Computers and Technology, 13.11.2019 22:31

Social Studies, 13.11.2019 22:31


