
Mathematics, 30.10.2019 15:31 ethanw8973
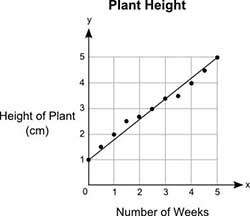
The graph shows the heights, y (in centimeters), of a plant after a certain number of weeks, x. donna drew the line of best fit on the graph.
what would most likely be the approximate height of the plant after 8 weeks?
11.0 centimeters
9.25 centimeters
8.8 centimeters
7.4 centimeters

Answers: 3


Other questions on the subject: Mathematics
Mathematics, 21.06.2019 14:10, madlenserlipepu1o
What is the factored form of x2 − 4x − 5? (x + 5)(x − 1) (x + 5)(x + 1) (x − 5)(x − 1) (x − 5)(x + 1)
Answers: 2
Mathematics, 21.06.2019 19:30, Animallover100
Write the sine and cosine values of a, b, respectively, in the figure for (1) and (2) + explanation.
Answers: 1
Mathematics, 21.06.2019 22:00, laureimaneaxel
The table below lists recommended amounts of food to order for 10 party guests. how much of each food item should nathan and amanda order for a graduation party with 55 guests? use the table to answer. item amount fried chicken 16 pieces lasagna 7 pounds deli meats 1.8 pounds sliced cheese 1 and two fifths pounds bakery buns 1 dozen potato salad 2 pounds
Answers: 3
Mathematics, 22.06.2019 02:30, misk980
Atrain traveled for 1.5 hours to the first station, stopped for 30 minutes, then traveled for 4 hours to the final station where it stopped for 1 hour. the total distance traveled is a function of time. which graph most accurately represents this scenario? a graph is shown with the x-axis labeled time (in hours) and the y-axis labeled total distance (in miles). the line begins at the origin and moves upward for 1.5 hours. the line then continues upward at a slow rate until 2 hours. from 2 to 6 hours, the line continues quickly upward. from 6 to 7 hours, it moves downward until it touches the x-axis a graph is shown with the axis labeled time (in hours) and the y axis labeled total distance (in miles). a line is shown beginning at the origin. the line moves upward until 1.5 hours, then is a horizontal line until 2 hours. the line moves quickly upward again until 6 hours, and then is horizontal until 7 hours a graph is shown with the axis labeled time (in hours) and the y-axis labeled total distance (in miles). the line begins at the y-axis where y equals 125. it is horizontal until 1.5 hours, then moves downward until 2 hours where it touches the x-axis. the line moves upward until 6 hours and then moves downward until 7 hours where it touches the x-axis a graph is shown with the axis labeled time (in hours) and the y-axis labeled total distance (in miles). the line begins at y equals 125 and is horizontal for 1.5 hours. the line moves downward until 2 hours, then back up until 5.5 hours. the line is horizontal from 5.5 to 7 hours
Answers: 1
You know the right answer?
The graph shows the heights, y (in centimeters), of a plant after a certain number of weeks, x. donn...
Questions in other subjects:

English, 05.05.2020 10:00
Mathematics, 05.05.2020 10:00

English, 05.05.2020 10:00
Mathematics, 05.05.2020 10:00


