
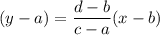
Which equation does the graph below represent?
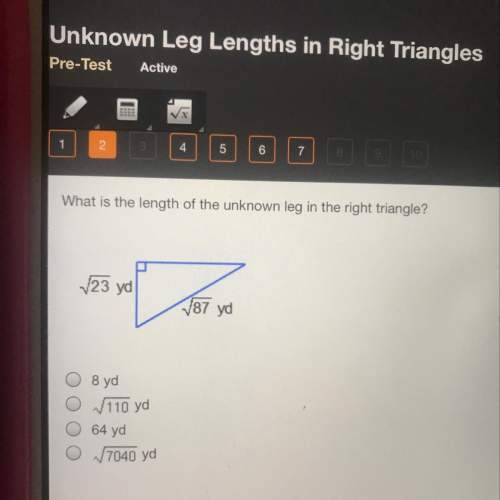
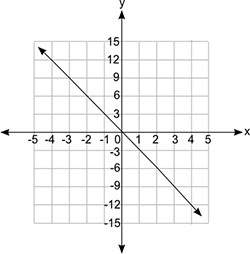
a coordinate grid is shown. the x-axis v...

Mathematics, 07.10.2019 13:30 alizeleach0123
Which equation does the graph below represent?
a coordinate grid is shown. the x-axis values are from negative 5 to positive 5 in increments of 1 for each grid line, and the y-axis values are from negative 15 to positive 15 in increments of 3 for each grid line. a line is shown passing through the ordered pairs negative 4, 12 and 0, 0 and 4, negative 12.
y = fraction negative 1 over 3x
y = −3x
y = 3x
y = fraction 1 over 3x

Answers: 2


Other questions on the subject: Mathematics
Mathematics, 21.06.2019 13:30, Chipper4085
An animal shelter has 21 puppies. if the puppies are 28% of the total dogs and cat population how many dogs and cats are in the animal shelter
Answers: 1
Mathematics, 21.06.2019 21:40, carson5238
If angle b measures 25°, what is the approximate perimeter of the triangle below? 10.3 units 11.8 units 22.1 units 25.2 units
Answers: 2
You know the right answer?
Questions in other subjects:


