

I'll fan
the graph below shows the height of a kicked soccer ball f(x), in feet, depending on...

Mathematics, 02.11.2019 23:31 joelpimentel
I'll fan
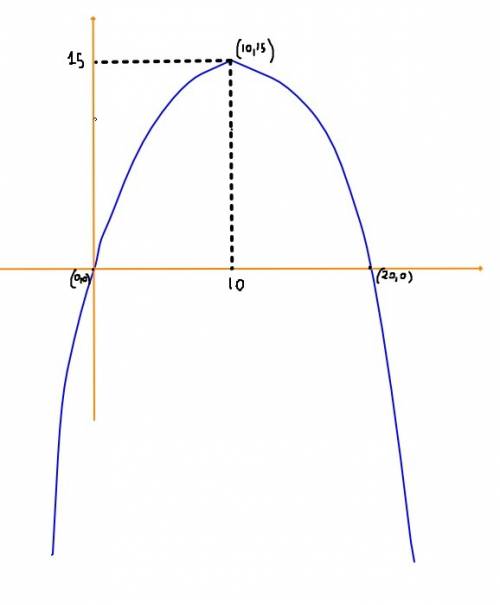
the graph below shows the height of a kicked soccer ball f(x), in feet, depending on the distance from the kicker x, in feet:
graph of quadratic function f of x having x intercepts at ordered pairs 0, 0 and 0, 20. the vertex is at 10, 15.
part a: what do the x-intercepts and maximum value of the graph represent? what are the intervals where the function is increasing and decreasing, and what do they represent about the distance and height? (6 points)
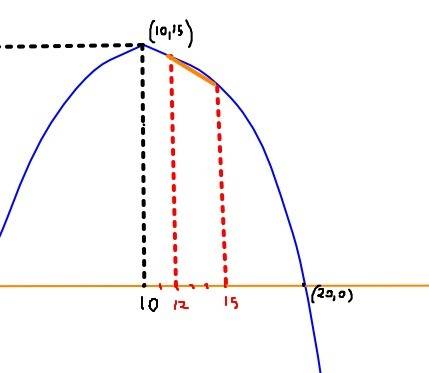
part b: what is an approximate average rate of change of the graph from x = 12 to x = 15, and what does this rate represent? (4 points)

Answers: 2


Other questions on the subject: Mathematics
Mathematics, 21.06.2019 22:00, foreverrocky12p2asun
Consider the triangle. which shows the order of the angles from smallest to largest? angle a, angle b, angle c angle b, angle a, angle c angle b, angle c, angle a angle c, angle a, angle b
Answers: 3
Mathematics, 21.06.2019 22:30, mbalderp5bxjo
Solve for x. −3/4(x+2)=6 enter your answer in the box
Answers: 1
Mathematics, 22.06.2019 05:30, tmrsavage02p7cj16
What is 2/4+1/4,find the common denominator
Answers: 2
You know the right answer?
Questions in other subjects:

Health, 02.03.2020 08:07

Social Studies, 02.03.2020 08:07

Computers and Technology, 02.03.2020 08:07


History, 02.03.2020 08:08


