
Mathematics, 21.10.2019 16:30 ksawyer745
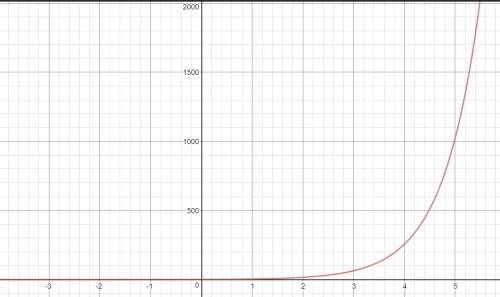
The table below represents a function. which statement would best describe the graph of the function
x 1 2 3 4. 5
y 1 16 64 256 1,024
a. the graph is a straight line that has a slope of 8
b. the grqph is a horizontal line at y=16
c. the graph starts flat but curves steeply upward
d. the graph is a parsbola that opens upward

Answers: 1
 .
.


Other questions on the subject: Mathematics
Mathematics, 21.06.2019 21:30, stressedmolly8387
An annual marathon covers a route that has a distance of approximately 26 miles. winning times for this marathon are all over 2 hours. the following data are the minutes over 2 hours for the winning male runners over two periods of 20 years each. earlier period 14 12 15 22 13 10 19 13 9 14 20 18 16 20 23 12 18 17 6 13 recent period 7 11 7 14 8 9 11 14 8 7 9 8 7 9 9 9 9 8 10 8 (a) make a stem-and-leaf display for the minutes over 2 hours of the winning times for the earlier period. use two lines per stem. (use the tens digit as the stem and the ones digit as the leaf. enter none in any unused answer blanks. for more details, view how to split a stem.) minutes beyond 2 hours earlier period 0 1 2 (b) make a stem-and-leaf display for the minutes over 2 hours of the winning times for the recent period. use two lines per stem. (use the tens digit as the stem and the ones digit as the leaf. enter none in any unused answer blanks.) minutes beyond 2 hours recent period (c) compare the two distributions. how many times under 15 minutes are in each distribution
Answers: 2
Mathematics, 22.06.2019 02:00, paulinahunl17
What is the area of this figure. select from the drop down box menu to correctly complete the statement shows a rectangle 3in. by 16in. and a trapezoid center is 10 in. by 5 in. answers are 128 136 153 258
Answers: 2
You know the right answer?
The table below represents a function. which statement would best describe the graph of the function...
Questions in other subjects:
Mathematics, 01.08.2019 17:00

Mathematics, 01.08.2019 17:00

Mathematics, 01.08.2019 17:00

History, 01.08.2019 17:00
English, 01.08.2019 17:00
Biology, 01.08.2019 17:00


