
Mathematics, 12.10.2019 18:50 kang39
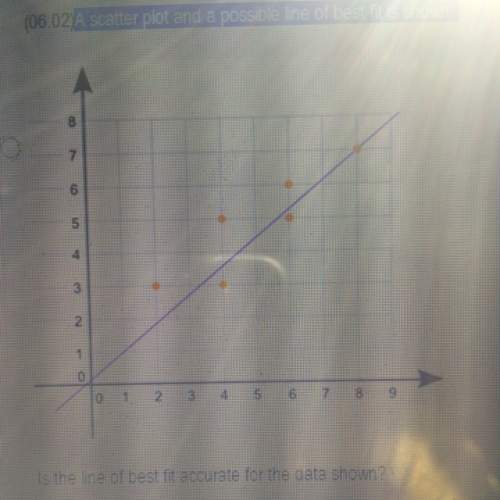
Will give 30 points a scatter plot and a possible line of best fit is shown is the line of best fit accurate for the data shown 1. yes because it touches the y-axis 2. yes because it passes through the center of data points 3. no because the line does not touch any points 4. no because the line should touch every point

Answers: 2


Other questions on the subject: Mathematics
Mathematics, 21.06.2019 16:20, whitneyt3218
7.(03.01 lc)which set represents the range of the function shown? {(-1, 5), (2,8), (5, 3), 13, -4)} (5 points){-1, 2, 5, 13){(5, -1), (8, 2), (3,5), (-4, 13)){-4, 3, 5, 8}{-4, -1, 2, 3, 5, 5, 8, 13}
Answers: 3
Mathematics, 21.06.2019 21:20, kaylaxocald
Se tiene en una caja de canicas 10, 4 blancas y 6 negras ¿cual es la probabilidad que en 2 extracciones con reemplazo sean blancas? ¿cual es la probalidad que en 2 extracciones sin reemplazo sean negras?
Answers: 1
Mathematics, 21.06.2019 22:00, gamallopatty
If i had 1234 apples and 1 banana what is the total amount
Answers: 2
You know the right answer?
Will give 30 points a scatter plot and a possible line of best fit is shown is the line of best fit...
Questions in other subjects:
Mathematics, 17.07.2021 01:00

Mathematics, 17.07.2021 01:00


Mathematics, 17.07.2021 01:00
Mathematics, 17.07.2021 01:00


