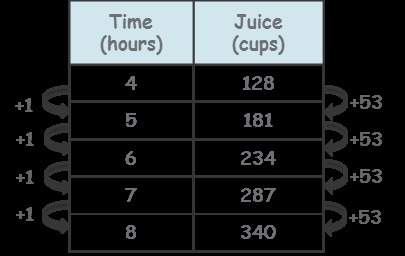
Rachel found this rate of change for the scenario represented in the table.
what can you...

Mathematics, 28.09.2019 22:00 mexicanvanilla
Rachel found this rate of change for the scenario represented in the table.
what can you conclude from her work? check all that apply.
the function is continuous.
time represents the dependent variable.
the scenario is represented by a linear function, since the rate of change is constant.
as the amount of time continues, there are fewer cups of juice poured per hour.
for every additional hour, 53 cups of juice are poured.

Answers: 2


Other questions on the subject: Mathematics
Mathematics, 21.06.2019 17:00, alannismichelle9
The following graph shows the consumer price index (cpi) for a fictional country from 1970 to 1980? a.) 1976 - 1978b.) 1972 - 1974c.) 1974 - 1976d.) 1978 - 1980
Answers: 1
Mathematics, 21.06.2019 17:20, bsheepicornozj0gc
What is the reflection image of (5,-3) across the line y = -x?
Answers: 1
You know the right answer?
Questions in other subjects:
Mathematics, 20.09.2020 03:01


Mathematics, 20.09.2020 03:01


