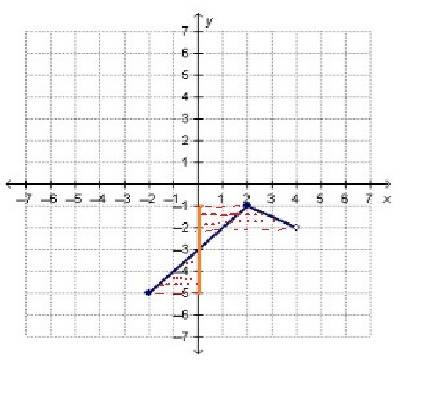
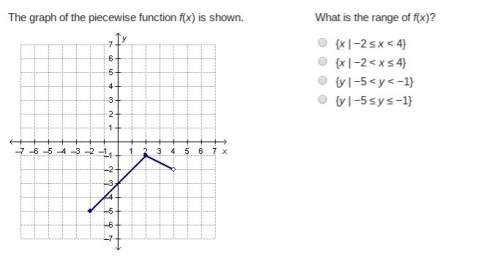
The graph of the piecewise function f(x) is shown.
what is the range of f(x)?
a || {x...

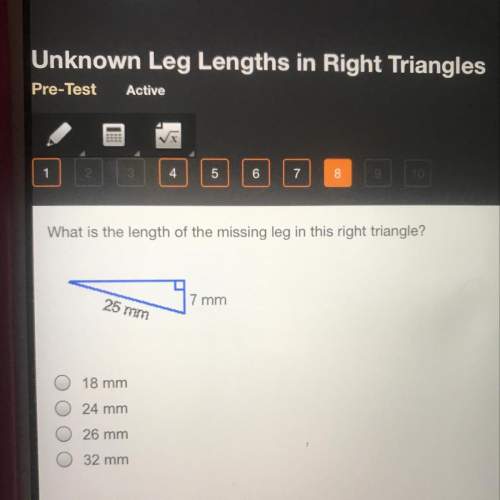
Mathematics, 20.10.2019 01:20 ashtynbursiaga
The graph of the piecewise function f(x) is shown.
what is the range of f(x)?
a || {x | −2 ≤ x < 4}
b || {x | −2 < x ≤ 4}
c || {y | −5 < y < −1}
d || {y | −5 ≤ y ≤ −1}

Answers: 3


Other questions on the subject: Mathematics
Mathematics, 21.06.2019 18:30, liltay12386
F(x)=x^3+4 question 6 options: the parent function is shifted up 4 units the parent function is shifted down 4 units the parent function is shifted left 4 units the parent function is shifted right 4 units
Answers: 1
Mathematics, 21.06.2019 23:40, Quidlord03
Which is the scale factor proportion for the enlargement shown?
Answers: 1
Mathematics, 22.06.2019 00:00, keshjdjsjs
The graph shows the decibel measure for sounds depending on how many times as intense they are as the threshold of sound. noise in a quiet room is 500 times as intense as the threshold of sound. what is the decibel measurement for the quiet room? 20 decibels28 decibels200 decibels280 decibels
Answers: 1
You know the right answer?
Questions in other subjects:

Mathematics, 19.03.2020 01:39

Mathematics, 19.03.2020 01:39
Mathematics, 19.03.2020 01:40


