
Mathematics, 18.10.2019 08:50 thebigman7993
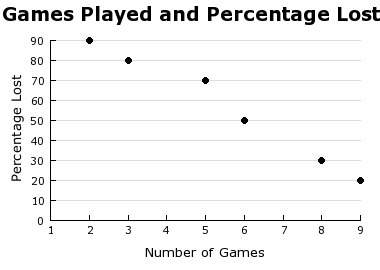
john-mark recorded the stats for several baseball pitchers. he made a scatterplot showing the number of games they played and the percentage they lost. which line is the best fit for this data?
y - 20 = 10(x - 9)
y + 20 = 10(x + 9)
y - 20 = -10(x - 9)
y + 20 = -10(x + 9)

Answers: 3


Other questions on the subject: Mathematics
Mathematics, 21.06.2019 19:50, ghwolf4p0m7x0
The graph shows the distance kerri drives on a trip. what is kerri's speed . a. 25 b.75 c.60 d.50
Answers: 1
Mathematics, 21.06.2019 22:00, erikacastro5404
The point of intersection of the diagonals of a rectangle is 4 cm further away from the smaller side then from the larger side of the rectangle. the perimeter of the rectangle is equal to 56 cm. find the lengths of the sides of the rectangle. 16 points answer quick
Answers: 1
You know the right answer?
john-mark recorded the stats for several baseball pitchers. he made a scatterplot showing the number...
Questions in other subjects:


Mathematics, 06.08.2021 23:50


