
Mathematics, 22.09.2019 04:30 aidanw
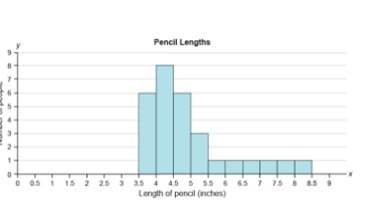
The histogram shows the lengths of pencils people in a study were using. which description best fits the distribution of the data shown in the histogram? a. approximately bell-shaped
b. skewed left
c. uniform
d. skewed right

Answers: 2


Other questions on the subject: Mathematics
Mathematics, 21.06.2019 18:00, mdlemuslopez
The graph shown is the graph of which function?
Answers: 2
Mathematics, 21.06.2019 20:00, jortizven0001
Seymour is twice as old as cassandra. if 16 is added to cassandra’s age and 16 is subtracted from seymour’s age, their ages become equal. what are their present ages? show !
Answers: 1
You know the right answer?
The histogram shows the lengths of pencils people in a study were using. which description best fits...
Questions in other subjects:
Mathematics, 03.02.2021 19:10
Mathematics, 03.02.2021 19:10


