
Mathematics, 20.01.2020 10:31 pickelswolf3036
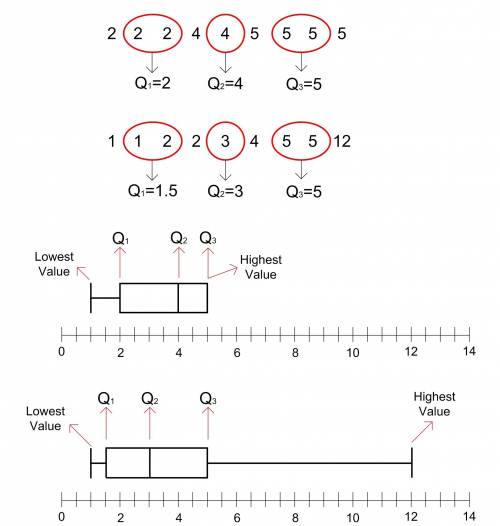
need plz the following table shows the number of hours some students in two neighborhoods spend walking to school each week: neighborhood a 5 2 4 2 5 5 4 5 2 neighborhood b 4 5 5 1 12 2 2 1 3 part a: create a five-number summary and calculate the interquartile range for the two sets of data. (6 points) part b: are the box plots symmetric? justify your answer. (4 points)

Answers: 1


Other questions on the subject: Mathematics
Mathematics, 22.06.2019 00:40, leannaadrian
If a distance of 75 yds is measured back from the edge of the canyon and two angles are measured , find the distance across the canyon angle acb = 50° angle abc=100° a=75 yds what does c equal?
Answers: 1
Mathematics, 22.06.2019 02:10, netflixacc0107
The human resources manager at a company records the length, in hours, of one shift at work, x. he creates the probability distribution below. what is the probability that a worker chosen at random works at least 8 hours? 0.62 0.78 0.84 0.96
Answers: 2
You know the right answer?
need plz the following table shows the number of hours some students in two neighborhoods spend wa...
Questions in other subjects:

Business, 12.07.2019 12:20

History, 12.07.2019 12:20

Chemistry, 12.07.2019 12:20


Social Studies, 12.07.2019 12:20
Business, 12.07.2019 12:20
Chemistry, 12.07.2019 12:20
Mathematics, 12.07.2019 12:20


