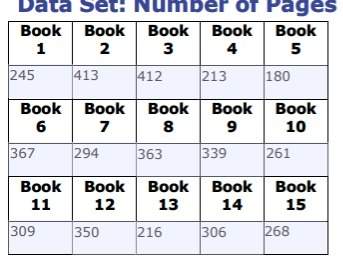
What would be the best graph or display for this data?
circle graph
venn diagram
...

Mathematics, 28.08.2019 11:10 LaytonHall79
What would be the best graph or display for this data?
circle graph
venn diagram
stem and leaf plot
frequency table
line plot
histogram
bar graph
line graph

Answers: 2


Other questions on the subject: Mathematics
Mathematics, 21.06.2019 16:00, aidengalvin20
Plz i beg u asap ! what is the equation of this graphed line? enter your answer in slope-intercept form in the box.
Answers: 2
Mathematics, 21.06.2019 21:10, zahradawkins2007
Identify the initial amount a and the growth factor b in the exponential function. a(x)=680*4.3^x
Answers: 2
Mathematics, 21.06.2019 21:30, ladydeathanddea
Amira is painting a rectangular banner 2 1/4 yards wide. the banner will have a blue background. amira has enough paint to cover 1 1/2 square yards of the wall. the school colors are blue and yellow, so amira wants to add yellow rectangles on the left and right sides of the blue rectangle. the yellow rectangles will each be 3/4 yards wide and the same height as the blue rectangle. what will be the total area of the two yellow rectangles?
Answers: 3
You know the right answer?
Questions in other subjects:


Advanced Placement (AP), 30.11.2019 19:31

Arts, 30.11.2019 19:31


Spanish, 30.11.2019 19:31
English, 30.11.2019 19:31
Spanish, 30.11.2019 19:31


