The graph shows the number of boys and girls who purchased different types of food.
whi...

Mathematics, 28.01.2020 20:54 kyle696969
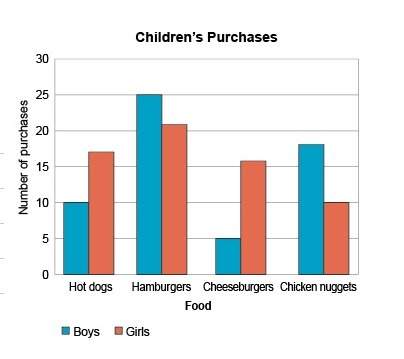
The graph shows the number of boys and girls who purchased different types of food.
which type of food had the greatest difference between the number of boys and number of girls who purchased it?
a.
hot dogs
b.
hamburgers
c.
cheeseburgers
d.
chicken nuggets

Answers: 3


Other questions on the subject: Mathematics
Mathematics, 21.06.2019 20:50, kassandramarie16
Amanda went into the grocery business starting with five stores. after one year, she opened two more stores. after two years, she opened two more stores than the previous year. if amanda expands her grocery business following the same pattern, which of the following graphs represents the number of stores she will own over time?
Answers: 3
Mathematics, 22.06.2019 04:00, ttrinityelyse17
What is the approximate value of the correlation coefficient for the given graph? a. 1 b. 5 c. 3 d. -1
Answers: 2
Mathematics, 22.06.2019 04:30, RichardKing2376
Arandom sample of 15 observations is used to estimate the population mean. the sample mean and the standard deviation are calculated as 172 and 63, respectively. assume that the population is normally distributed. a. with 99 confidence, what is the margin of error for the estimation of the population mean? b. construct the 99% confidence interval for the population mean. c. construct the 95% confidence interval for the population mean. d. construct the 83% confidence interval for the population mean. hint: you need to use excel function =t. inv.2t to find the value of t for the interval calculation.
Answers: 1
Mathematics, 22.06.2019 05:00, amsley19
On her way to work, mrs. larsen gets a green light at a certain traffic light only 30% of the time. she wants to find the probability that she will get a green light at this traffic light all five mornings that she travels to work next week. use the following randomly generated list of 200 five-digit numbers to answer the questions and find the probability. select the digits you will use to represent a favorable outcome. how many favorable outcomes are on this list? what are they? given this simulation, what is the probability that mrs. larsen will get a green light at this traffic light all five mornings next week?
Answers: 1
You know the right answer?
Questions in other subjects:


