This graph shows the number of scarves lucy made in the first 6 days of knitting.
by da...

Mathematics, 30.12.2019 12:31 chriscook1466
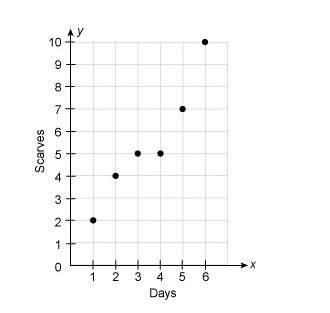
This graph shows the number of scarves lucy made in the first 6 days of knitting.
by day 3, lucy had made a total of 5 scarves (2 scarves on day 1, 2 scarves on day 2, and 1 scarf on day 3).
on which day did lucy and martha not make any scarves?
a.
1
b.
3
c.
4
d.
5

Answers: 3


Other questions on the subject: Mathematics
Mathematics, 21.06.2019 17:40, kayleeemerson77
The graph of h(x)= |x-10| +6 is shown. on which interval is this graph increasing
Answers: 2
You know the right answer?
Questions in other subjects:


