
Mathematics, 15.12.2019 03:31 mashedpotatoes28
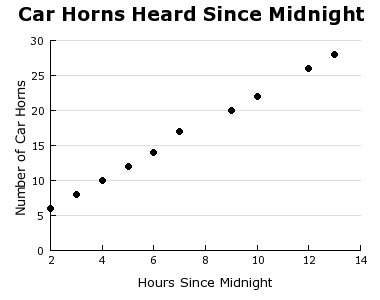
The graph shows the relationship between the number of cars horns sally heard and the amount of time that has passed since midnight. she has no data for 11 hours after midnight. according to the scatterplot, about how many car horns did she hear at that time?
a) 22
b) 24
c) 26
d) 28
need asap

Answers: 2


Other questions on the subject: Mathematics
Mathematics, 21.06.2019 22:30, jack487
Graph the system of inequalities presented here on your own paper, then use your graph to answer the following questions: y > 2x + 3y is less than negative 3 over 2 times x minus 4part a: describe the graph of the system, including shading and the types of lines graphed. provide a description of the solution area. (6 points)part b: is the point (â’4, 6) included in the solution area for the system? justify your answer mathematically. (4 points)
Answers: 1
You know the right answer?
The graph shows the relationship between the number of cars horns sally heard and the amount of time...
Questions in other subjects:
Mathematics, 15.01.2021 22:40

Biology, 15.01.2021 22:40
Mathematics, 15.01.2021 22:40

English, 15.01.2021 22:40
Mathematics, 15.01.2021 22:40
English, 15.01.2021 22:40


