
Mathematics, 28.09.2019 11:50 fatherbamboo
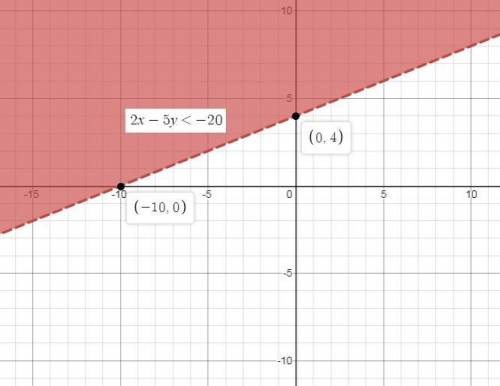
Which graph represents the given inequality 2x-5y< -20

Answers: 1


Other questions on the subject: Mathematics
Mathematics, 21.06.2019 19:00, ortizprecious5183
How do the definitions, properties, and postulates you've learned about line segments, parallel lines, and angles to define the shapes of polygons
Answers: 1
Mathematics, 21.06.2019 20:50, xbeatdroperzx
Ms. ortiz sells tomatoes wholesale. the function p(x)=-80x^2+320x-10, graphed below, indicates how much profit she makes on a load of tomatoes if she makes on a load of tomatoes if she sells them for 4-x dollars per kilogram. what should ms. ortiz charge per kilogram of tomatoes to make on a load of tomatoes?
Answers: 2
Mathematics, 21.06.2019 23:50, kordejah348
Which of the following are independent events? a) knowing that it is going to rain tomorrow, and bringing an umbrella to schoolb) knowing that you have to get up early tomorrow, and going to bed before 9 p. mc) knowing that it is going to rain tomorrow, and going to bed before 9 p. md) knowing that you have a test in school tomorrow, and studying thw night before
Answers: 2
You know the right answer?
Which graph represents the given inequality 2x-5y< -20...
Questions in other subjects:

Mathematics, 25.05.2021 21:40


Mathematics, 25.05.2021 21:40


