
Mathematics, 14.10.2019 16:30 kenz2797
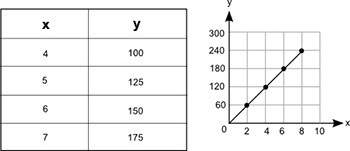
The table and the graph below each show a different relationship between the same two variables, x and y: a table with two columns and 5 rows is shown. the column head for the left column is x, and the column head for the right column is y. the row entries in the table are 4 comma 100 and 5 comma 125 and 6 comma 150 and 7 comma 175. on the right of this table is a graph. the x-axis values are from 0 to 10 in increments of 2 for each grid line. the y-axis values on the graph are from 0 to 300 in increments of 60 for each grid line. a line passing through the ordered pairs 2 comma 60 and 4 comma 120 and 6 comma 180 and 8 comma 240 is drawn. how much more would the value of y be on the graph than its value in the table when x = 12?

Answers: 2


Other questions on the subject: Mathematics
Mathematics, 21.06.2019 19:30, vanessagallion
Evaluate 3(a + b + c)squared for a = 2, b = 3, and c = 4. a. 54 b. 243 c.729 add solution .
Answers: 1
Mathematics, 21.06.2019 21:30, lainnn974
Questions 7-8. use the following table to answer. year 2006 2007 2008 2009 2010 2011 2012 2013 cpi 201.6 207.342 215.303 214.537 218.056 224.939 229.594 232.957 7. suppose you bought a house in 2006 for $120,000. use the table above to calculate the 2013 value adjusted for inflation. (round to the nearest whole number) 8. suppose you bought a house in 2013 for $90,000. use the table above to calculate the 2006 value adjusted for inflation. (round to the nearest whole number)
Answers: 3
Mathematics, 22.06.2019 00:30, woodfordmaliky
Tim has obtained a 3/27 balloon mortgage. after the initial period, he decided to refinance the balloon payment with a new 30-year mortgage. how many years will he be paying for his mortgage in total?
Answers: 2
Mathematics, 22.06.2019 02:00, pgjohnston001
Pls what is the relative minimum of the function? enter your answer in the box
Answers: 3
You know the right answer?
The table and the graph below each show a different relationship between the same two variables, x a...
Questions in other subjects:
Mathematics, 31.08.2019 07:10


English, 31.08.2019 07:10

Arts, 31.08.2019 07:10
English, 31.08.2019 07:10


