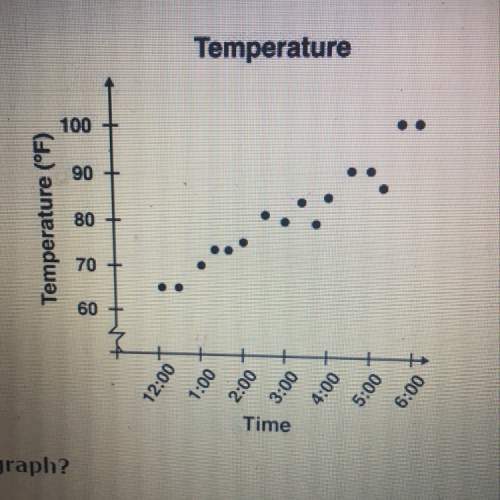
The graph shows the temperature from 12: 00 pm to 6: 00 pm
what type of trend is shown in the...

Mathematics, 19.09.2019 06:30 maddyclark19
The graph shows the temperature from 12: 00 pm to 6: 00 pm
what type of trend is shown in the graph?
a) positive
b) constant
c) no trend is shown in the graph
d) negative

Answers: 2


Other questions on the subject: Mathematics
Mathematics, 21.06.2019 18:00, huntbuck14
What is the range for 31,39,29,34,37,24,36,33,34,28
Answers: 1
Mathematics, 21.06.2019 18:00, rawaanasser12245
Pat listed all the numbers that have 15 as a multiple write the numbers in pats list
Answers: 2
Mathematics, 21.06.2019 22:10, Jenifermorales101
Write the function for the graph. (1.8) (0,4)
Answers: 3
You know the right answer?
Questions in other subjects:


Social Studies, 07.03.2021 16:10
Mathematics, 07.03.2021 16:10

Health, 07.03.2021 16:10
Chemistry, 07.03.2021 16:10

History, 07.03.2021 16:10
Mathematics, 07.03.2021 16:10


