
Mathematics, 06.12.2019 16:31 haileybug0305
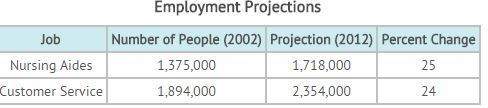
Employment projections job number of people (2002) projection (2012) percent change nursing aides 1,375,000 1,718,000 25 customer service 1,894,000 2,354,000 24 according to the chart for the projection of people in jobs in 2002 and ten years later, nursing aides had the larger percent of people added, but they added the smaller number of people. why is this true? a) the chart contains an error. b) nursing aides had more jobs added. c) nursing aides had more people in 2002. d) nursing aides had fewer people in 2002.

Answers: 3


Other questions on the subject: Mathematics
Mathematics, 21.06.2019 15:00, jtingley0502
1. are the triangles similar and if so why? what is the value of x? show your work.
Answers: 2
Mathematics, 21.06.2019 16:50, thegoat3180
The lines shown below are parallel. if the green line has a slope of -1, what is the slope of the red line?
Answers: 1
Mathematics, 21.06.2019 20:30, ElegantEmerald
A. plot the data for the functions f(x) and g(x) on a grid and connect the points. x -2 -1 0 1 2 f(x) 1/9 1/3 1 3 9 x -2 -1 0 1 2 g(x) -4 -2 0 2 4 b. which function could be described as exponential and which as linear? explain. c. if the functions continue with the same pattern, will the function values ever be equal? if so, give estimates for the value of x that will make the function values equals. if not, explain why the function values will never be equal.
Answers: 3
You know the right answer?
Employment projections job number of people (2002) projection (2012) percent change nursing aides 1,...
Questions in other subjects:

Biology, 11.03.2020 01:02


Mathematics, 11.03.2020 01:02

Mathematics, 11.03.2020 01:02


