
Mathematics, 28.01.2020 18:09 dbegay36
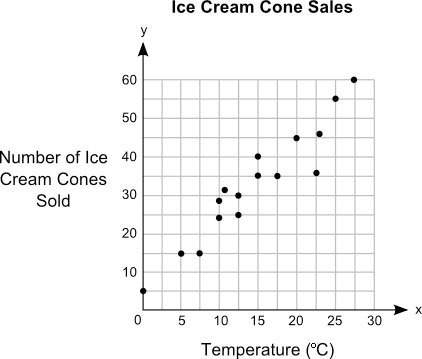
Jack plotted the graph below to show the relationship between the temperature of his city and the number of ice cream cones he sold daily:
part a: in your own words, describe the relationship between the temperature of the city and the number of ice cream cones sold. (5 points)
part b: describe how you can make the line of best fit. write the approximate slope and y-intercept of the line of best fit. show your work, including the points that you use to calculate slope and y-intercept. (5 points)

Answers: 2


Other questions on the subject: Mathematics
Mathematics, 21.06.2019 22:30, mbalderp5bxjo
Solve for x. −3/4(x+2)=6 enter your answer in the box
Answers: 1
Mathematics, 22.06.2019 01:10, anggar20
Pamela has a 30-year, 5.75% mortgage on her $250,000 home. she has been paying on it for 5 years, and has recently hit some financial trouble. if her lender agreed to lower the interest rate on her $231,905.47 balance to 5.5%, what will her new payment be for the remainder of the loan?
Answers: 2
Mathematics, 22.06.2019 02:30, gracie0818
Last month, leonhard euler's watch kiosk at the mall had total sales of $9,489. merchandise totaling $225 was returned. the goods that were sold cost leonhard euler's $5,481. operating expenses for the moth were $992. what was the gross profit on sales?
Answers: 1
You know the right answer?
Jack plotted the graph below to show the relationship between the temperature of his city and the nu...
Questions in other subjects:

Chemistry, 10.11.2020 01:00


Mathematics, 10.11.2020 01:00
Mathematics, 10.11.2020 01:00


