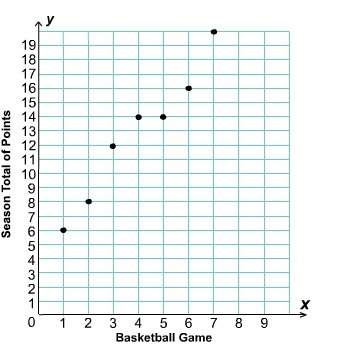
This graph shows the points john scored in the first 7 games of the basketball season.
...

Mathematics, 07.11.2019 21:31 Puppy9118
This graph shows the points john scored in the first 7 games of the basketball season.
by game 3, john had scored a total of 12 points (6 points in game one, 2 points in game two, and 4 points in game three).
in which game did john not score any points?
a.
1
b.
2
c.
4
d.
5
graph is below

Answers: 1


Other questions on the subject: Mathematics
Mathematics, 21.06.2019 22:30, kdtd3163
In a certain city, the hourly wage of workers on temporary employment contracts is normally distributed. the mean is $15 and the standard deviation is $3. what percentage of temporary workers earn less than $12 per hour? a. 6% b. 16% c. 26% d. 36%
Answers: 1
Mathematics, 21.06.2019 23:00, sjjarvis53211
Mrs. sling bought a pound of green beans for $1.80. how much will mrs. tennison pay for 3 1/2 pounds of green beans?
Answers: 1
You know the right answer?
Questions in other subjects:


History, 24.07.2019 14:00

Social Studies, 24.07.2019 14:00

History, 24.07.2019 14:00
Mathematics, 24.07.2019 14:00


