
Mathematics, 28.09.2019 11:20 trvptrav
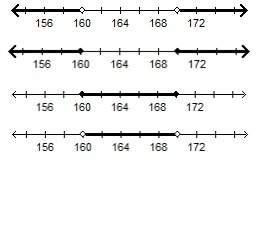
Achef knows that ground beef used for hamburger is safe to eat once it reaches 160 degrees fahrenheit. for optimized taste and safety, he will not allow a hamburger cooked to a temperature under 160 degrees or over 170 degrees to be served. which graph represents the conditions under which the chef will not allow the hamburger to be served?

Answers: 2


Other questions on the subject: Mathematics
Mathematics, 21.06.2019 15:30, DJEMPGYT
Will give are given that xy is parallel to zw. if xz is a transversal that intercepts xy and zw, angle angle alternate interior angles. since xy is parallel to zw, we know that these angles are we also know that angle xvy and angle zvw are , and thus congruent. we can conclude that △xyv ~ △zwv using the similarity theorem.
Answers: 2
Mathematics, 21.06.2019 17:40, kayleeemerson77
The graph of h(x)= |x-10| +6 is shown. on which interval is this graph increasing
Answers: 2
Mathematics, 21.06.2019 20:10, Maddi7328
The graph and table shows the relationship between y, the number of words jean has typed for her essay and x, the number of minutes she has been typing on the computer. according to the line of best fit, about how many words will jean have typed when she completes 60 minutes of typing? 2,500 2,750 3,000 3,250
Answers: 1
You know the right answer?
Achef knows that ground beef used for hamburger is safe to eat once it reaches 160 degrees fahrenhei...
Questions in other subjects:


Mathematics, 13.03.2021 01:00

Arts, 13.03.2021 01:00

Arts, 13.03.2021 01:00
Physics, 13.03.2021 01:00

History, 13.03.2021 01:00


