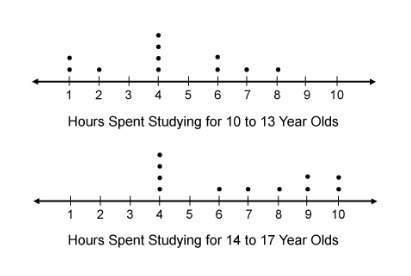
The line plots show the number of hours two groups of kids spent studying last weekend.
how do...

Mathematics, 02.09.2019 18:40 carma43
The line plots show the number of hours two groups of kids spent studying last weekend.
how does the data compare for the two groups of kids?
a: the 14- to 17-year olds spent more hours studying, on average, last weekend than the 10- to 13-year olds.
b: the median value for the hours spent studying last weekend for the 10- to 13-year olds is greater than the median value for the hours spent studying last weekend for the 14- to 17-year olds.
c: the 10- to 13-year olds spent an average of 6 hours studying last weekend.
d: the range for the hours spent studying last weekend for the 10- to 13-year olds is the same as the range for the hours spent studying last weekend for the 14- to 17-year olds.

Answers: 2


Other questions on the subject: Mathematics
Mathematics, 21.06.2019 23:00, firefightergros7271
Match the vocabulary to the proper definition. in probability, two events in which 1. conditional probability the outcome of one event is independent of the outcome of a second event. 2. dependent events in probability, two events in which the outcome of one event is dependent on the outcome of a second event. the probability of an event in which the outcome of the event is conditional on the outcome of one or more different events. 3. independent events
Answers: 2
Mathematics, 21.06.2019 23:30, Omarrdz214
Robin spent 25% more time on his research project than he had planned he’s been an extra h ours on the project which of the following expressions could represent the number of hours rob actually spent on the project
Answers: 3
You know the right answer?
Questions in other subjects:

Biology, 23.07.2019 05:30
Mathematics, 23.07.2019 05:30
Mathematics, 23.07.2019 05:30

Social Studies, 23.07.2019 05:30

Biology, 23.07.2019 05:30


