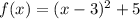
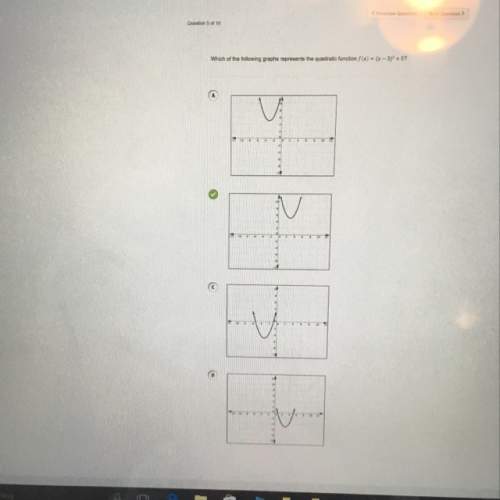
Which of the following graphs represents the quadratic function f(x)=(x-3)^2+5
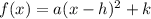
...

Mathematics, 11.01.2020 17:31 krojas015
Which of the following graphs represents the quadratic function f(x)=(x-3)^2+5

Answers: 2


Other questions on the subject: Mathematics
Mathematics, 21.06.2019 20:00, sadsociety41
Afamily has five members. a mom, a dad, two sisters, & a brother. the family lines up single file. what is the probabillity that the mom is at the front of the line
Answers: 1
Mathematics, 21.06.2019 21:50, bcox32314
Desmond wants to sell his car that he paid $8,000 for 2 years ago. the car depreciated, or decreased in value, at a constant rate each month over a 2-year period. if x represents the monthly depreciation amount, which expression shows how much desmond can sell his car for today? \ 8,000 + 24x 8,000 - 24x 8,000 + 2x 8,000 - 2x
Answers: 3
You know the right answer?
Questions in other subjects:

Social Studies, 01.10.2019 20:50

History, 01.10.2019 20:50

Chemistry, 01.10.2019 20:50

History, 01.10.2019 20:50
Mathematics, 01.10.2019 20:50


