

Consider the graph below:
which of the following equations does the graph represent?
a...

Mathematics, 28.08.2019 22:30 jackievelasquez3424
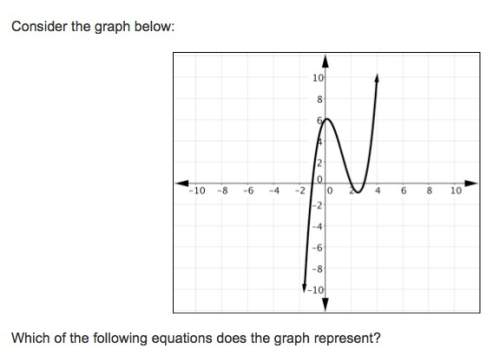
Consider the graph below:
which of the following equations does the graph represent?
a) y = ( x - 1 ) ( x + 3 ) ( x + 2 )
b) y = - ( x - 1 ) ( x + 3 ) ( x + 2 )
c) y = ( x + 1 ) ( x - 3 ) ( x - 2)
d) y = - ( x + 1 ) ( x - 3 ) ( x - 2 )

Answers: 2


Other questions on the subject: Mathematics
Mathematics, 21.06.2019 20:00, cielo2761
The table below represents a linear function f(x) and the equation represents a function g(x): x f(x) −1 −5 0 −1 1 3 g(x) g(x) = 2x − 7 part a: write a sentence to compare the slope of the two functions and show the steps you used to determine the slope of f(x) and g(x). (6 points) part b: which function has a greater y-intercept? justify your answer. (4 points)
Answers: 2
Mathematics, 22.06.2019 01:00, zhellyyyyy
Find all the angles that satisfy the equation cos(θ)=32
Answers: 2
You know the right answer?
Questions in other subjects:

Mathematics, 10.10.2021 08:50


