
Mathematics, 19.11.2019 09:31 orlando19882000
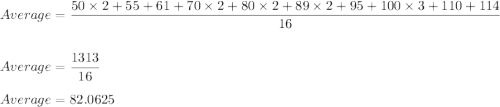
The dot plot below shows the amount of time two random groups of students took to solve a puzzle:
a dot plot shows puzzle solving time in seconds on the horizontal axis. for group a, there is 1 dot on 65, 1 dot on 67, 1 dot on 77, 1 dot on 79, 1 dot on 88, 1 dot on 90, 2 dots on 92, 1 dot on 100, 2 dots on 102, 1 dot on 109, 1 dot on 110, 2 dots on 112, 1 dot on 122, 1 dot on 136, and 1 dot on 139. for group b, there are 2 dots on 50, 1 dot on 55, 1 dot on 61, 2 dots on 70, 2 dots on 80, 2 dots on 89, 1 dot on 95, 3 dots on 100, 1 dot on 110, and 1 dot on 114.
based on visual inspection of the dot plots, which of the following groups, if any, shows a greater average time required to solve the puzzle?
group a
group b
both groups show about the same average time.
no conclusion about average time can be made from the data.

Answers: 3


Other questions on the subject: Mathematics
Mathematics, 21.06.2019 19:30, BarcaOsama
Which of the following is the explicit rule for a geometric sequence defined a recursive formula of a -5a for which the first term is 23?
Answers: 1
Mathematics, 21.06.2019 21:30, billydeck30
Amachine part consists of a half sphere and a cylinder, as shown in the figure. the total volume of the part is π cubic inches.
Answers: 1
Mathematics, 21.06.2019 21:30, shymitch32
Create a graph for the demand for starfish using the following data table: quantity/price of starfish quantity (x axis) of starfish in dozens price (y axis) of starfish per dozen 0 8 2 6 3 5 5 2 7 1 9 0 is the relationship between the price of starfish and the quantity demanded inverse or direct? why? how many dozens of starfish are demanded at a price of five? calculate the slope of the line between the prices of 6 (quantity of 2) and 1 (quantity of 7) per dozen. describe the line when there is a direct relationship between price and quantity.
Answers: 3
Mathematics, 22.06.2019 00:00, hannahgracew12
Which is a logical conclusion based on the given information? a. figure abcd is a rhombus by the definition of a rhombus. b. segment ac is congruent to segment dc by cpctc. c. angle acb is congruent to angle adc by the angle-side-angle theorem. d. triangle acd is congruent to triangle cab by the hypotenuse-leg theorem.
Answers: 1
You know the right answer?
The dot plot below shows the amount of time two random groups of students took to solve a puzzle:
Questions in other subjects:

Mathematics, 24.06.2021 08:40
Mathematics, 24.06.2021 08:40


Arts, 24.06.2021 08:40

Computers and Technology, 24.06.2021 08:40
Mathematics, 24.06.2021 08:40
Mathematics, 24.06.2021 08:40
History, 24.06.2021 08:40

English, 24.06.2021 08:40


