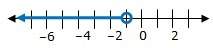
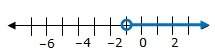
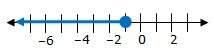
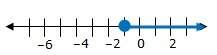
Choose the graph that shows the solution of the inequality on the number line
c< -1
...

Mathematics, 23.12.2019 10:31 NJSX54661
Choose the graph that shows the solution of the inequality on the number line
c< -1
a
b
c
d
they are in order

Answers: 1


Other questions on the subject: Mathematics
Mathematics, 21.06.2019 13:00, veronica25681
(6.03) what is the constant term in the expression 6x3y + 7x2 + 5x + 4? (input a numeric value only.) numerical answers expected! me pls! fast pls
Answers: 3
Mathematics, 21.06.2019 17:00, trinityanne1738
Two streets intersect at a 30- degree angle. at the intersection, the are four crosswalks formed that are the same length. what type of quadrilateral is formed by the crosswalks?
Answers: 2
Mathematics, 21.06.2019 18:30, angelina6836
Anormally distributed data set has a mean of 176.3 and a standard deviation of 4.2. what is the approximate z-score for the data value of 167.9? 2.00 −2.00 8.4 −8.4
Answers: 2
You know the right answer?
Questions in other subjects:
Mathematics, 14.11.2020 02:00

History, 14.11.2020 02:00
Mathematics, 14.11.2020 02:00
Mathematics, 14.11.2020 02:00
Mathematics, 14.11.2020 02:00
Mathematics, 14.11.2020 02:00

English, 14.11.2020 02:00


