Will give medal!
identify the mapping diagram that represents the relation and determine whet...

Mathematics, 18.10.2019 21:30 lumikuz123
Will give medal!
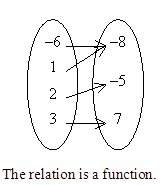
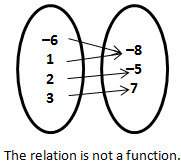
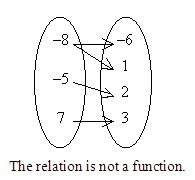
identify the mapping diagram that represents the relation and determine whether the relation is a function: {(-8, -6), (-5, 2), (-8, 1), (7, 3)}


Answers: 2


Other questions on the subject: Mathematics
Mathematics, 21.06.2019 21:50, godzilla24
If you double the input of a function and it results in half the output, and if you triple the input and it results in a third of the output, what can be guessed about the function? check all that apply.
Answers: 3
Mathematics, 22.06.2019 02:00, mathhelppls14
1. the manager of collins import autos believes the number of cars sold in a day (q) depends on two factors: (1) the number of hours the dealership is open (h) and (2) the number of salespersons working that day (s). after collecting data for two months (53 days), the manager estimates the following log-linear model: q 4 equation 1 a. explain, how to transform the log-linear model into linear form that can be estimated using multiple regression analysis. the computer output for the multiple regression analysis is shown below: q4 table b. how do you interpret coefficients b and c? if the dealership increases the number of salespersons by 20%, what will be the percentage increase in daily sales? c. test the overall model for statistical significance at the 5% significance level. d. what percent of the total variation in daily auto sales is explained by this equation? what could you suggest to increase this percentage? e. test the intercept for statistical significance at the 5% level of significance. if h and s both equal 0, are sales expected to be 0? explain why or why not? f. test the estimated coefficient b for statistical significance. if the dealership decreases its hours of operation by 10%, what is the expected impact on daily sales?
Answers: 2
Mathematics, 22.06.2019 03:00, sarath30
This size running track is usually called a 400 meter track. however if a person ran as close to the inside as possible on the track they would run less than 400 meters in one lap. how far away from the inside border would someone have to run to make one lap equal exactly 400 meters
Answers: 2
You know the right answer?
Questions in other subjects:

Health, 30.01.2020 16:55
Mathematics, 30.01.2020 16:55

Mathematics, 30.01.2020 16:55
Mathematics, 30.01.2020 16:55
Mathematics, 30.01.2020 16:55
Mathematics, 30.01.2020 16:55


