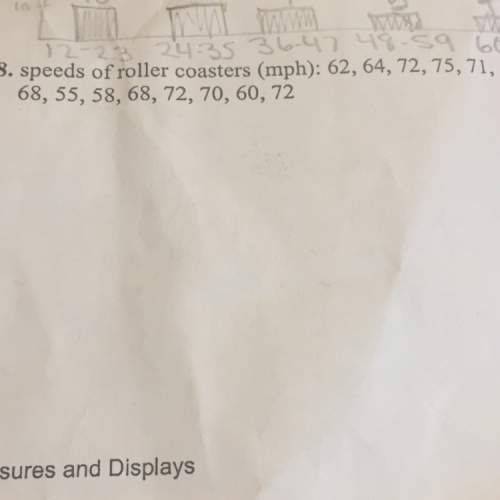
Draw a histogram to represent each set of data.
...

Mathematics, 18.09.2019 17:30 arrissa1234hinkle
Draw a histogram to represent each set of data.

Answers: 1


Other questions on the subject: Mathematics
Mathematics, 21.06.2019 15:00, suewignall
Need ! give step by step solutions on how to solve number one \frac{9-2\sqrt{3} }{12+\sqrt{3} } number two x+4=\sqrt{13x-20} number three (domain and range) f(x)=2\sqrt[3]{x} +1
Answers: 2
You know the right answer?
Questions in other subjects:

Mathematics, 20.01.2021 23:10

Arts, 20.01.2021 23:10

Mathematics, 20.01.2021 23:10

Mathematics, 20.01.2021 23:10

Biology, 20.01.2021 23:10

Social Studies, 20.01.2021 23:10
Arts, 20.01.2021 23:10


