The linear equality represented by the graphis  and it matches with
  .
.
Further explanation:
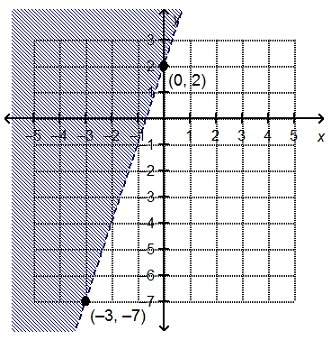
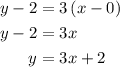
It is given that a line passes through points  and
and  as shown below in Figure 1
The slope of a line passes through points  and
and  is calculated as follows:
 ......(1)
Here, the slope of a line is denoted as  and points are and .
Substitute  for
for  ,
,  for
for  ,
,  for
for  and
and  for
for  in equation (1) to obtain the slope of a line that passes through points
  and .
and .

Therefore, the slope is  .
.
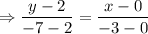
The point-slope form of the equation of a line with slope passes through point is represented as follows:
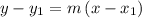 ......(2)
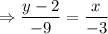
Substitute for , for and for in equation (2) to obtain the equation of line.
Therefore, the value of  is
is  .
.
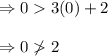
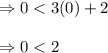
Since the shaded part in Figure 1 is above the equation of line  , therefore, greater than sign is used instead of is equal to.
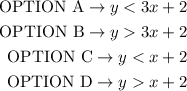
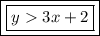
Thus, the linear inequality is  as shown below in Figure 2.
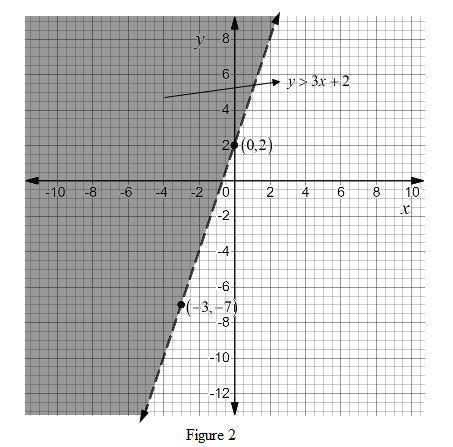
Now, the four options are given below.
Since OPTION B matches the obtained equation that is .
Thus, the linear equality represented by the graph is and it matches with .
Learn more:
1. Which classification best describes the following system of equations?
2. What is the value of in the equation when ?
3. What are the values of x?
Answer Details:
Grade: Junior High School
Subject: Mathematics
Chapter: Coordinate Geometry
Keywords:Coordinate Geometry, linear equation, system of linear equations in two variables, variables, mathematics,equation of line, line, passes through point, inequality


 ,
,
 . This area is the opposite to the desired area, so this is not the right answer.