Which graph is the graph of the function?
g(x) = |x + 3|
...

Mathematics, 26.12.2019 20:31 agarcia24101993
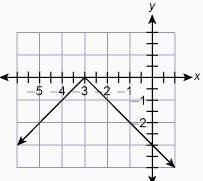
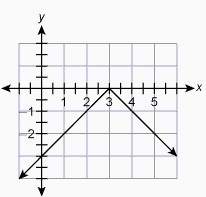
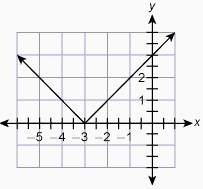
Which graph is the graph of the function?
g(x) = |x + 3|


Answers: 2


Other questions on the subject: Mathematics
Mathematics, 21.06.2019 21:30, vaelriacb5317
Is triangle jkl congruent to triangle rst? if so, what is the scale factor?
Answers: 1
Mathematics, 21.06.2019 23:30, meiyrarodriguez
Write an inequality for this sentence the quotient of a number and -5 increased by 4 is at most 8
Answers: 1
Mathematics, 22.06.2019 01:00, AvaHeff
The stem-and-leaf plot shows the heights in centimeters of teddy bear sunflowers grown in two different types of soil. soil a soil b 5 9 5 2 1 1 6 3 9 5 1 0 7 0 2 3 6 7 8 2 1 8 3 0 9 key: 9|6 means 69 key: 5|8 means 58 calculate the mean of each data set. calculate the mean absolute deviation (mad) of each data set. which set is more variable? how do you know?
Answers: 2
You know the right answer?
Questions in other subjects:

Health, 17.02.2021 01:30
Mathematics, 17.02.2021 01:30


History, 17.02.2021 01:30
English, 17.02.2021 01:30

Mathematics, 17.02.2021 01:30


