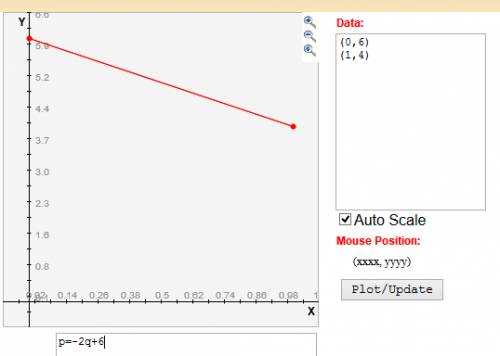
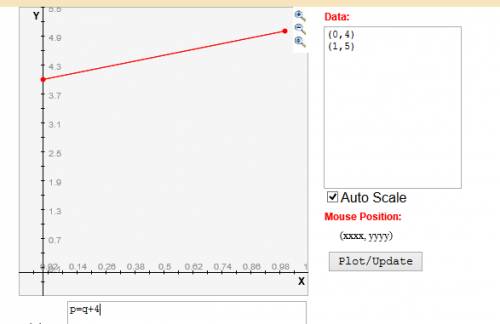

Plotting these two equations on a graph.
p=6-2q
p=4+q...

Mathematics, 19.08.2019 02:30 kyla322
Plotting these two equations on a graph.
p=6-2q
p=4+q

Answers: 1


Other questions on the subject: Mathematics
Mathematics, 21.06.2019 21:10, ttrinityelyse17
The table below shows the approximate height of an object x seconds after the object was dropped. the function h(x)= -16x^2 +100 models the data in the table. for which value of x would this model make it the least sense to use? a. -2.75 b. 0.25 c. 1.75 d. 2.25
Answers: 2
You know the right answer?
Questions in other subjects:

Biology, 06.11.2020 04:40


Mathematics, 06.11.2020 04:40

Mathematics, 06.11.2020 04:40

Physics, 06.11.2020 04:40


