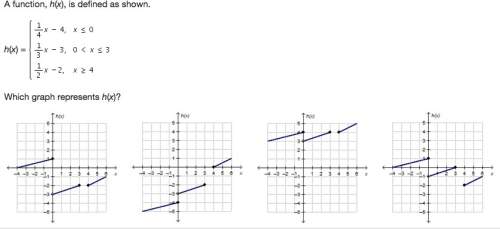
given: for the given function h(x), we have given four conditions
(i) h(x) = (x ÷4) - 4 when x ≤ 0
here, if x = 0, -1 , -2, -3, -4 then h(x) = -4, -4.25, -4.50, -4.75, -5
from the above data, it represents the bottom line of the 2nd graph. (ii) h(x) = (x ÷3) - 3 when 0< x ≤ 3
here, if x = 1, 2, 3 then h(x) = - 2.7, - 2.3, - 2.0
from the above data, it represents the second last bottom line of the 2nd graph.
(iii) h(x) = (x ÷2) - 2 when x ≥ 4
here, if x = 4, 5, 6, 7 h(x) = 0, 0.5, 1.0,
from the above data, it represents the top line of the 2nd graph.
hence, the correct representation of the given function will be the second graph.