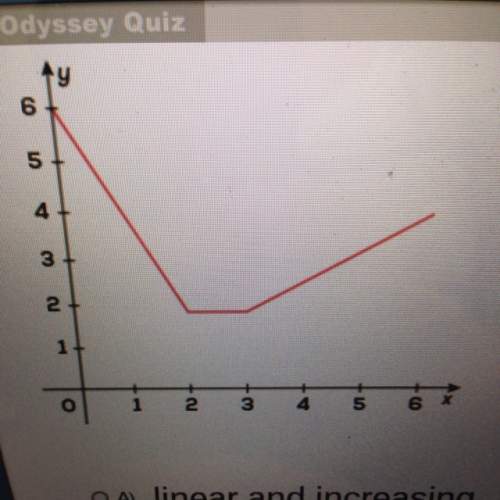
Which statement describes the graph of the function between x=3 and x=6?
a.) linear an...

Mathematics, 04.02.2020 00:03 uticabadgirl
Which statement describes the graph of the function between x=3 and x=6?
a.) linear and increasing
b.) linear and decreasing
c.) non linear and increasing
d.) non linear and decreasing

Answers: 3


Other questions on the subject: Mathematics
Mathematics, 21.06.2019 15:30, 001234567891011
Abike shop sells you a bicycle for $63 and a helmet for $21. the total cost is 150% of what the shop spent originally. how much did the shop spend originally? how much profit did the bike shop earn by selling the bicycle and helmet to you ?
Answers: 1
Mathematics, 21.06.2019 16:00, tdun7003
Find the area and perimeter of each composite figure. use 3.14 for π. round your answer to the nearest tenth. a square and a right triangle share a common side. image long description a 3-meter by 0.5-meter rectangle has triangles attached like wings to the 3-meter sides. the other two sides of both triangles measure 2.5 meters. the height of each triangle is 2 meters. a 6-inch by 4-inch rectangle has 2 half-circles attached like wings to the 6-inch sides. the radius of each half-circle is 3 inches. find the surface area and volume of each figure. use 3.14 for π. round your answer to the nearest tenth. a right circular cylinder has a base radius of 6 yards and a height of 20 yards. a rectangular prism has a base that is 9 centimeters long and 7 centimeters wide. the height is 2 centimeters. a rectangular prism has a base that measures 11 millimeters by 11 millimeters. the height is 11 millimeters.
Answers: 1
Mathematics, 21.06.2019 17:30, lizzy2951
Someone this asap for a group of students attends a basketball game. * the group buys x hot dogs at the concession stand for $2 each. * the group buys y drinks at the concession stand for $3 each. the group buys 29 items at the concession stand for a total of $70. how many hot dogs did the group buy?
Answers: 2
Mathematics, 21.06.2019 20:00, ertgyhn
In new york city at the spring equinox there are 12 hours 8 minutes of daylight. the longest and shortest days of the year very by two hours and 53 minutes from the equinox in this year the equinox falls on march 21 in this task you use trigonometric function to model the hours of daylight hours on certain days of the year in new york city a. what is the independent and dependent variables? b. find the amplitude and the period of the function. c. create a trigonometric function that describes the hours of sunlight for each day of the year. d. graph the function you build in part c. e. use the function you build in part c to find out how many fewer daylight hours february 10 will have than march 21. you may look at the calendar.
Answers: 1
You know the right answer?
Questions in other subjects:


History, 28.01.2021 14:10
Mathematics, 28.01.2021 14:10

Mathematics, 28.01.2021 14:10
Mathematics, 28.01.2021 14:10
Mathematics, 28.01.2021 14:10
Mathematics, 28.01.2021 14:10


