subject
Mathematics, 02.02.2020 00:43 xXwolfieplayzXx

1.
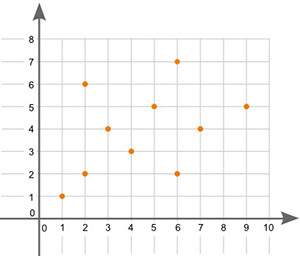
what type of association does the graph show between x and y?

(4 points)

a. linear positive association
b. nonlinear positive association
c. nonlinear negative association
d. no association


1.  what type of association does the graph show between x and y?  (4 points)

ansver
Answers: 2

Other questions on the subject: Mathematics

image
Mathematics, 21.06.2019 12:30, edna27
(note i put the graph in so plz )the graph shows the amount of water that remains in a barrel after it begins to leak. the variable x represents the number of days that have passed since the barrel was filled, and y represents the number of gallons of water that remain in the barrel. what is the slope of the line
Answers: 1
image
Mathematics, 21.06.2019 17:30, missperfectionp89qqq
Hello can you me find all the products
Answers: 1
image
Mathematics, 21.06.2019 20:00, 12bluestone
Someone answer asap for ! a discount store’s prices are 25% lower than department store prices. the function c(x) = 0.75x can be used to determine the cost c, in dollars, of an item, where x is the department store price, in dollars. if the item has not sold in one month, the discount store takes an additional 20% off the discounted price and an additional $5 off the total purchase. the function d(y) = 0.80y - 5 can be used to find d, the cost, in dollars, of an item that has not been sold for a month, where y is the discount store price, in dollars. create a function d(c(x)) that represents the final price of an item when a costumer buys an item that has been in the discount store for a month. d(c(x)) =
Answers: 1
image
Mathematics, 21.06.2019 20:30, oprajapati
1yd 1 ft = 1 1/12 1 1/3 1 1/2 1 1/6
Answers: 1