Which equation(s) represent the graph below?
i: y=(x+2)(x^2-4x-12)
ii: y=(x-3)(x^2+x-...

Mathematics, 18.09.2019 04:00 uchapman6286
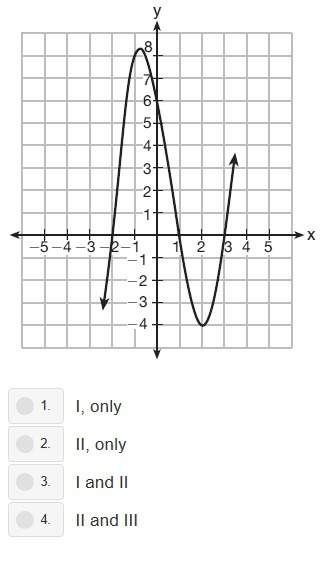
Which equation(s) represent the graph below?
i: y=(x+2)(x^2-4x-12)
ii: y=(x-3)(x^2+x-2)
iii: y=(x-1)(x^2-5x-6)
picture and answer choices are shown in the photo! !
a bunch!

Answers: 1


Other questions on the subject: Mathematics
Mathematics, 22.06.2019 02:00, lexhoangg
Now, martin can reasonably guess that the standard deviation for the entire population of people at the mall during the time of the survey is $1.50. what is the 95% confidence interval about the sample mean? interpret what this means in the context of the situation where 95 people were surveyed and the sample mean is $8. use the information in this resource to construct the confidence interval.
Answers: 3
Mathematics, 22.06.2019 05:00, Flowershere121
Draw a number line to represent the inequality y< 64
Answers: 2
You know the right answer?
Questions in other subjects:
Mathematics, 20.08.2019 10:00


Geography, 20.08.2019 10:00
History, 20.08.2019 10:00

Social Studies, 20.08.2019 10:00
Mathematics, 20.08.2019 10:00


