
Mathematics, 28.01.2020 01:31 maggie123456751
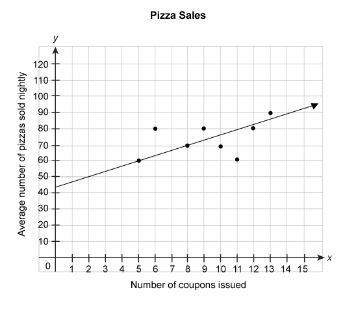
The scatter plot below shows the number of pizzas sold during weeks when different numbers of coupons were issued. the equation represents the linear model for this data.
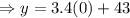
y = 3.4x + 43
according to the model, what is the average number of pizzas sold in one night if no coupons are issued?
a. 0
b. 21
c. 43
d. 60
e. 70

Answers: 2


Other questions on the subject: Mathematics
Mathematics, 21.06.2019 20:00, haileyhale5
What are the domain and range of the function f(x)=2^x+1
Answers: 1
You know the right answer?
The scatter plot below shows the number of pizzas sold during weeks when different numbers of coupon...
Questions in other subjects:


Biology, 18.10.2019 03:40

Health, 18.10.2019 03:40


Social Studies, 18.10.2019 03:40

Chemistry, 18.10.2019 03:40
History, 18.10.2019 03:40


