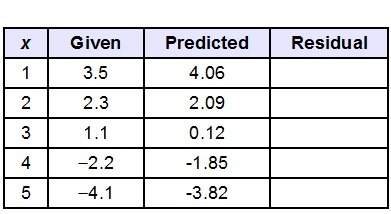
Find the residual values, and use the graphing calculator tool to make a residual plot.
...

Mathematics, 21.01.2020 03:31 tia0625
Find the residual values, and use the graphing calculator tool to make a residual plot.
does the residual plot show that the line of best fit is appropriate for the data?
a. yes, the points are evenly distributed about the x-axis.
b. no, the points have no pattern.
c. no, the points are in a linear pattern.
d. yes, the points are in a curved pattern.

Answers: 1


Other questions on the subject: Mathematics
Mathematics, 21.06.2019 14:50, alayciaruffin076
Brook states that the distance on the line is 4 units. caleb states that the whole line does not have a distance because it continues on forever. vivian states that the line is 6 units long. which distance did brook measure? which distance did vivian measure?
Answers: 3
Mathematics, 21.06.2019 21:30, drepeter86
50 people men and women were asked if they watched at least one sport on tv. 20 of the people surveyed are women, but only 9 of them watch at least one sport on tv. 16 of the men watch at least one sport on tv. make a a two-way table and a relative frequency table to represent the data.
Answers: 3
Mathematics, 21.06.2019 21:30, xxaurorabluexx
Use the method of cylindrical shells to find the volume v generated by rotating the region bounded by the curves about the given axis. y = 7ex, y = 7e^-x, x = 1; about the y-axis
Answers: 2
You know the right answer?
Questions in other subjects:

Mathematics, 12.03.2021 21:40


Biology, 12.03.2021 21:40

Chemistry, 12.03.2021 21:40
English, 12.03.2021 21:40
Mathematics, 12.03.2021 21:40


