
Mathematics, 30.01.2020 16:48 KaseyT
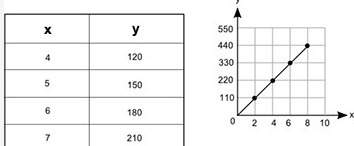
The table and the graph below each show a different relationship between the same two variables, x and y:
*insert attached picture here*
how much more would the value of y be on the graph than its value in the table when x = 12?
i added the y values for both until i got twelve and i subtracted the table's final y value from the graph's. i ended up with 410 but the only answer choices are:
150
300
450
600
what am i doing wrong?

Answers: 2


Other questions on the subject: Mathematics
Mathematics, 21.06.2019 13:00, lamwil9432
20 points! asap! a is known to be 6,500 feet above sea level; ab = 600 feet. the angle at a looking up at p is 20°. the angle at b looking up at p is 35°. how far above sea level is the peak p? find the height of the mountain peak to the nearest foot. height above sea level =
Answers: 1
Mathematics, 21.06.2019 18:30, lethycialee79711
What is the result of converting 60 ounces to pounds remember there are 16 ounces in a pound
Answers: 2
You know the right answer?
The table and the graph below each show a different relationship between the same two variables, x a...
Questions in other subjects:


History, 18.10.2020 06:01
Mathematics, 18.10.2020 06:01
Mathematics, 18.10.2020 06:01
History, 18.10.2020 06:01

Chemistry, 18.10.2020 06:01
Mathematics, 18.10.2020 06:01


