Can someone backmeup here
the scatter plot shows the relationship between the average nu...

Mathematics, 09.10.2019 14:30 tdyson3p6xvtu
Can someone backmeup here
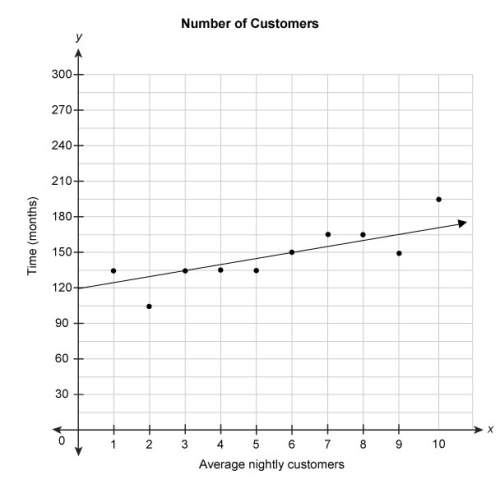
the scatter plot shows the relationship between the average number of nightly customers and the number of months since a restaurant opened. the equation represents the linear model for this data.
y = 5x + 20
what does the number 5 in the equation mean in this context?
the restaurant has been open for 5 months.
there were 5 customers per month after the restaurant was open 120 months.
the average number of customers per night increased by 5 each month.
there were 5 customers per night when the restaurant opened.
for every 5 months the restaurant has been open, there are 120 more customers per night.

Answers: 1


Other questions on the subject: Mathematics
Mathematics, 21.06.2019 20:30, cheating53
Kayaks rent for $35 per day. which expression can you use to find the cost in dollars of renting 3 kayaks for a day?
Answers: 1
Mathematics, 21.06.2019 23:00, mattdallas6214
Type the correct answer in each box. use numerals instead of words. the average number of subscribers to an online magazine each year from 2010 to 2015 is given in the table below. the average number of subscribers to the online magazine in 2010 was the percent increase in the average number of subscribers in 2011 to the average number of subscribers in 2012 was %. the maximum average number of subscribers to the online magazine in the years shown was
Answers: 2
Mathematics, 22.06.2019 01:10, girdwood797
|p| > 3 {-3, 3} {p|-3 < p < 3} {p|p < -3 or p > 3}
Answers: 2
You know the right answer?
Questions in other subjects:

Health, 16.10.2020 18:01

Computers and Technology, 16.10.2020 18:01

History, 16.10.2020 18:01

Physics, 16.10.2020 18:01
Mathematics, 16.10.2020 18:01
Health, 16.10.2020 18:01

Health, 16.10.2020 18:01


