Which equation could represent the relationship shown in the scatter plot?
y=−3/4x+10
y...

Mathematics, 29.08.2019 16:00 Jennifer16253
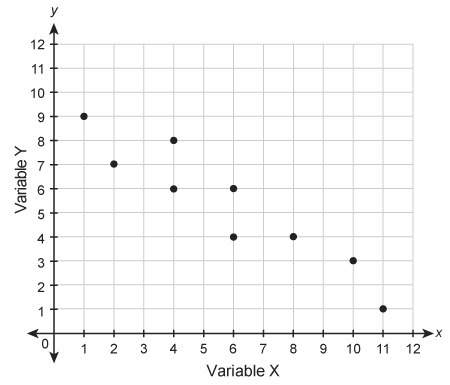
Which equation could represent the relationship shown in the scatter plot?
y=−3/4x+10
y=−2/3x+1
y=−3x−2
y=9x−1/2

Answers: 1


Other questions on the subject: Mathematics
Mathematics, 21.06.2019 19:00, lashaeperson
How does a low unemployment rate affect a nation's economy? a. the nation has a higher number of productive resources. b. the nation can spend more money on for unemployed people. c. the nation can save money by paying lower salaries to a large workforce. reset
Answers: 1
Mathematics, 21.06.2019 21:30, stressedmolly8387
An annual marathon covers a route that has a distance of approximately 26 miles. winning times for this marathon are all over 2 hours. the following data are the minutes over 2 hours for the winning male runners over two periods of 20 years each. earlier period 14 12 15 22 13 10 19 13 9 14 20 18 16 20 23 12 18 17 6 13 recent period 7 11 7 14 8 9 11 14 8 7 9 8 7 9 9 9 9 8 10 8 (a) make a stem-and-leaf display for the minutes over 2 hours of the winning times for the earlier period. use two lines per stem. (use the tens digit as the stem and the ones digit as the leaf. enter none in any unused answer blanks. for more details, view how to split a stem.) minutes beyond 2 hours earlier period 0 1 2 (b) make a stem-and-leaf display for the minutes over 2 hours of the winning times for the recent period. use two lines per stem. (use the tens digit as the stem and the ones digit as the leaf. enter none in any unused answer blanks.) minutes beyond 2 hours recent period (c) compare the two distributions. how many times under 15 minutes are in each distribution
Answers: 2
Mathematics, 21.06.2019 23:30, 20lap01
(c) compare the results of parts (a) and (b). in general, how do you think the mode, median, and mean are affected when each data value in a set is multiplied by the same constant? multiplying each data value by the same constant c results in the mode, median, and mean increasing by a factor of c. multiplying each data value by the same constant c results in the mode, median, and mean remaining the same. multiplying each data value by the same constant c results in the mode, median, and mean decreasing by a factor of c. there is no distinct pattern when each data value is multiplied by the same constant. (d) suppose you have information about average heights of a random sample of airline passengers. the mode is 65 inches, the median is 72 inches, and the mean is 65 inches. to convert the data into centimeters, multiply each data value by 2.54. what are the values of the mode, median, and mean in centimeters? (enter your answers to two decimal places.) mode cm median cm mean cm in this problem, we explore the effect on the mean, median, and mode of multiplying each data value by the same number. consider the following data set 7, 7, 8, 11, 15. (a) compute the mode, median, and mean. (enter your answers to one (1) decimal places.) mean value = median = mode = (b) multiply 3 to each of the data values. compute the mode, median, and mean. (enter your answers to one (1) decimal places.) mean value = median = mode = --
Answers: 1
You know the right answer?
Questions in other subjects:
Mathematics, 03.07.2020 01:01


Mathematics, 03.07.2020 01:01


