
Mathematics, 24.10.2019 21:43 antcobra
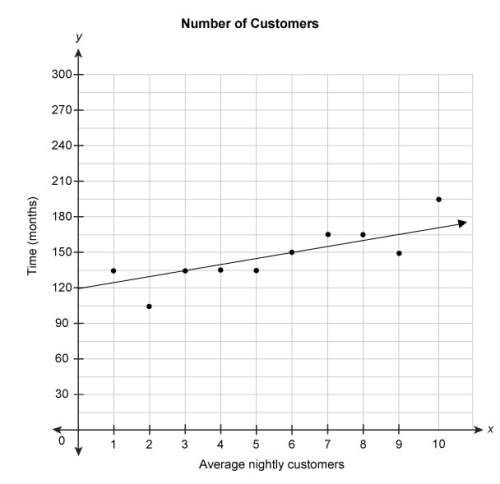
Need answers asap. the scatter plot shows the relationship between the average number of nightly customers and the number of months since a restaurant opened. the equation represents the linear model for this data.
y = 5x + 120
what does the number 120 in the equation mean in this context?
the restaurant has been open for 120 months.
there were 120 customers per month after the restaurant was open 5 months.
the number of customers per night increases by 120 each month.
for every 5 months the restaurant has been open, there are 120 more customers per night.
there were 120 customers per night when the restaurant opened.

Answers: 3


Other questions on the subject: Mathematics
Mathematics, 21.06.2019 17:40, kayleeemerson77
The graph of h(x)= |x-10| +6 is shown. on which interval is this graph increasing
Answers: 2
Mathematics, 21.06.2019 21:00, Rebelyfe4175
Meghan has created a diagram of her city with her house, school, store, and gym identified. a. how far is it from the gym to the store? b. meghan also wants to walk to get some exercise, rather than going to the gym. she decides to walk along arc ab. how far will she walk? round to 3 decimal places.
Answers: 2
You know the right answer?
Need answers asap. the scatter plot shows the relationship between the average number of nightly cus...
Questions in other subjects:


Mathematics, 29.08.2019 06:30


Computers and Technology, 29.08.2019 06:30


History, 29.08.2019 06:30


